Bike Sharing Case Study
- Tech Stack: Machine Learning · Analytical Skills · Linear Regression · Statistical Data Analysis · Data Visualization.
- Github URL: Project Link
- Case Study: Subjective Question
BoomBikes, a US-based bike-sharing provider, faced a sharp revenue decline due to the COVID-19 pandemic. The project aimed to model post-quarantine bike demand using a linear model, identifying key variables influencing revenue and predicting demand. The goal was to align BoomBikes’ strategies with customer needs and market trends, ensuring profitability.
Insights:
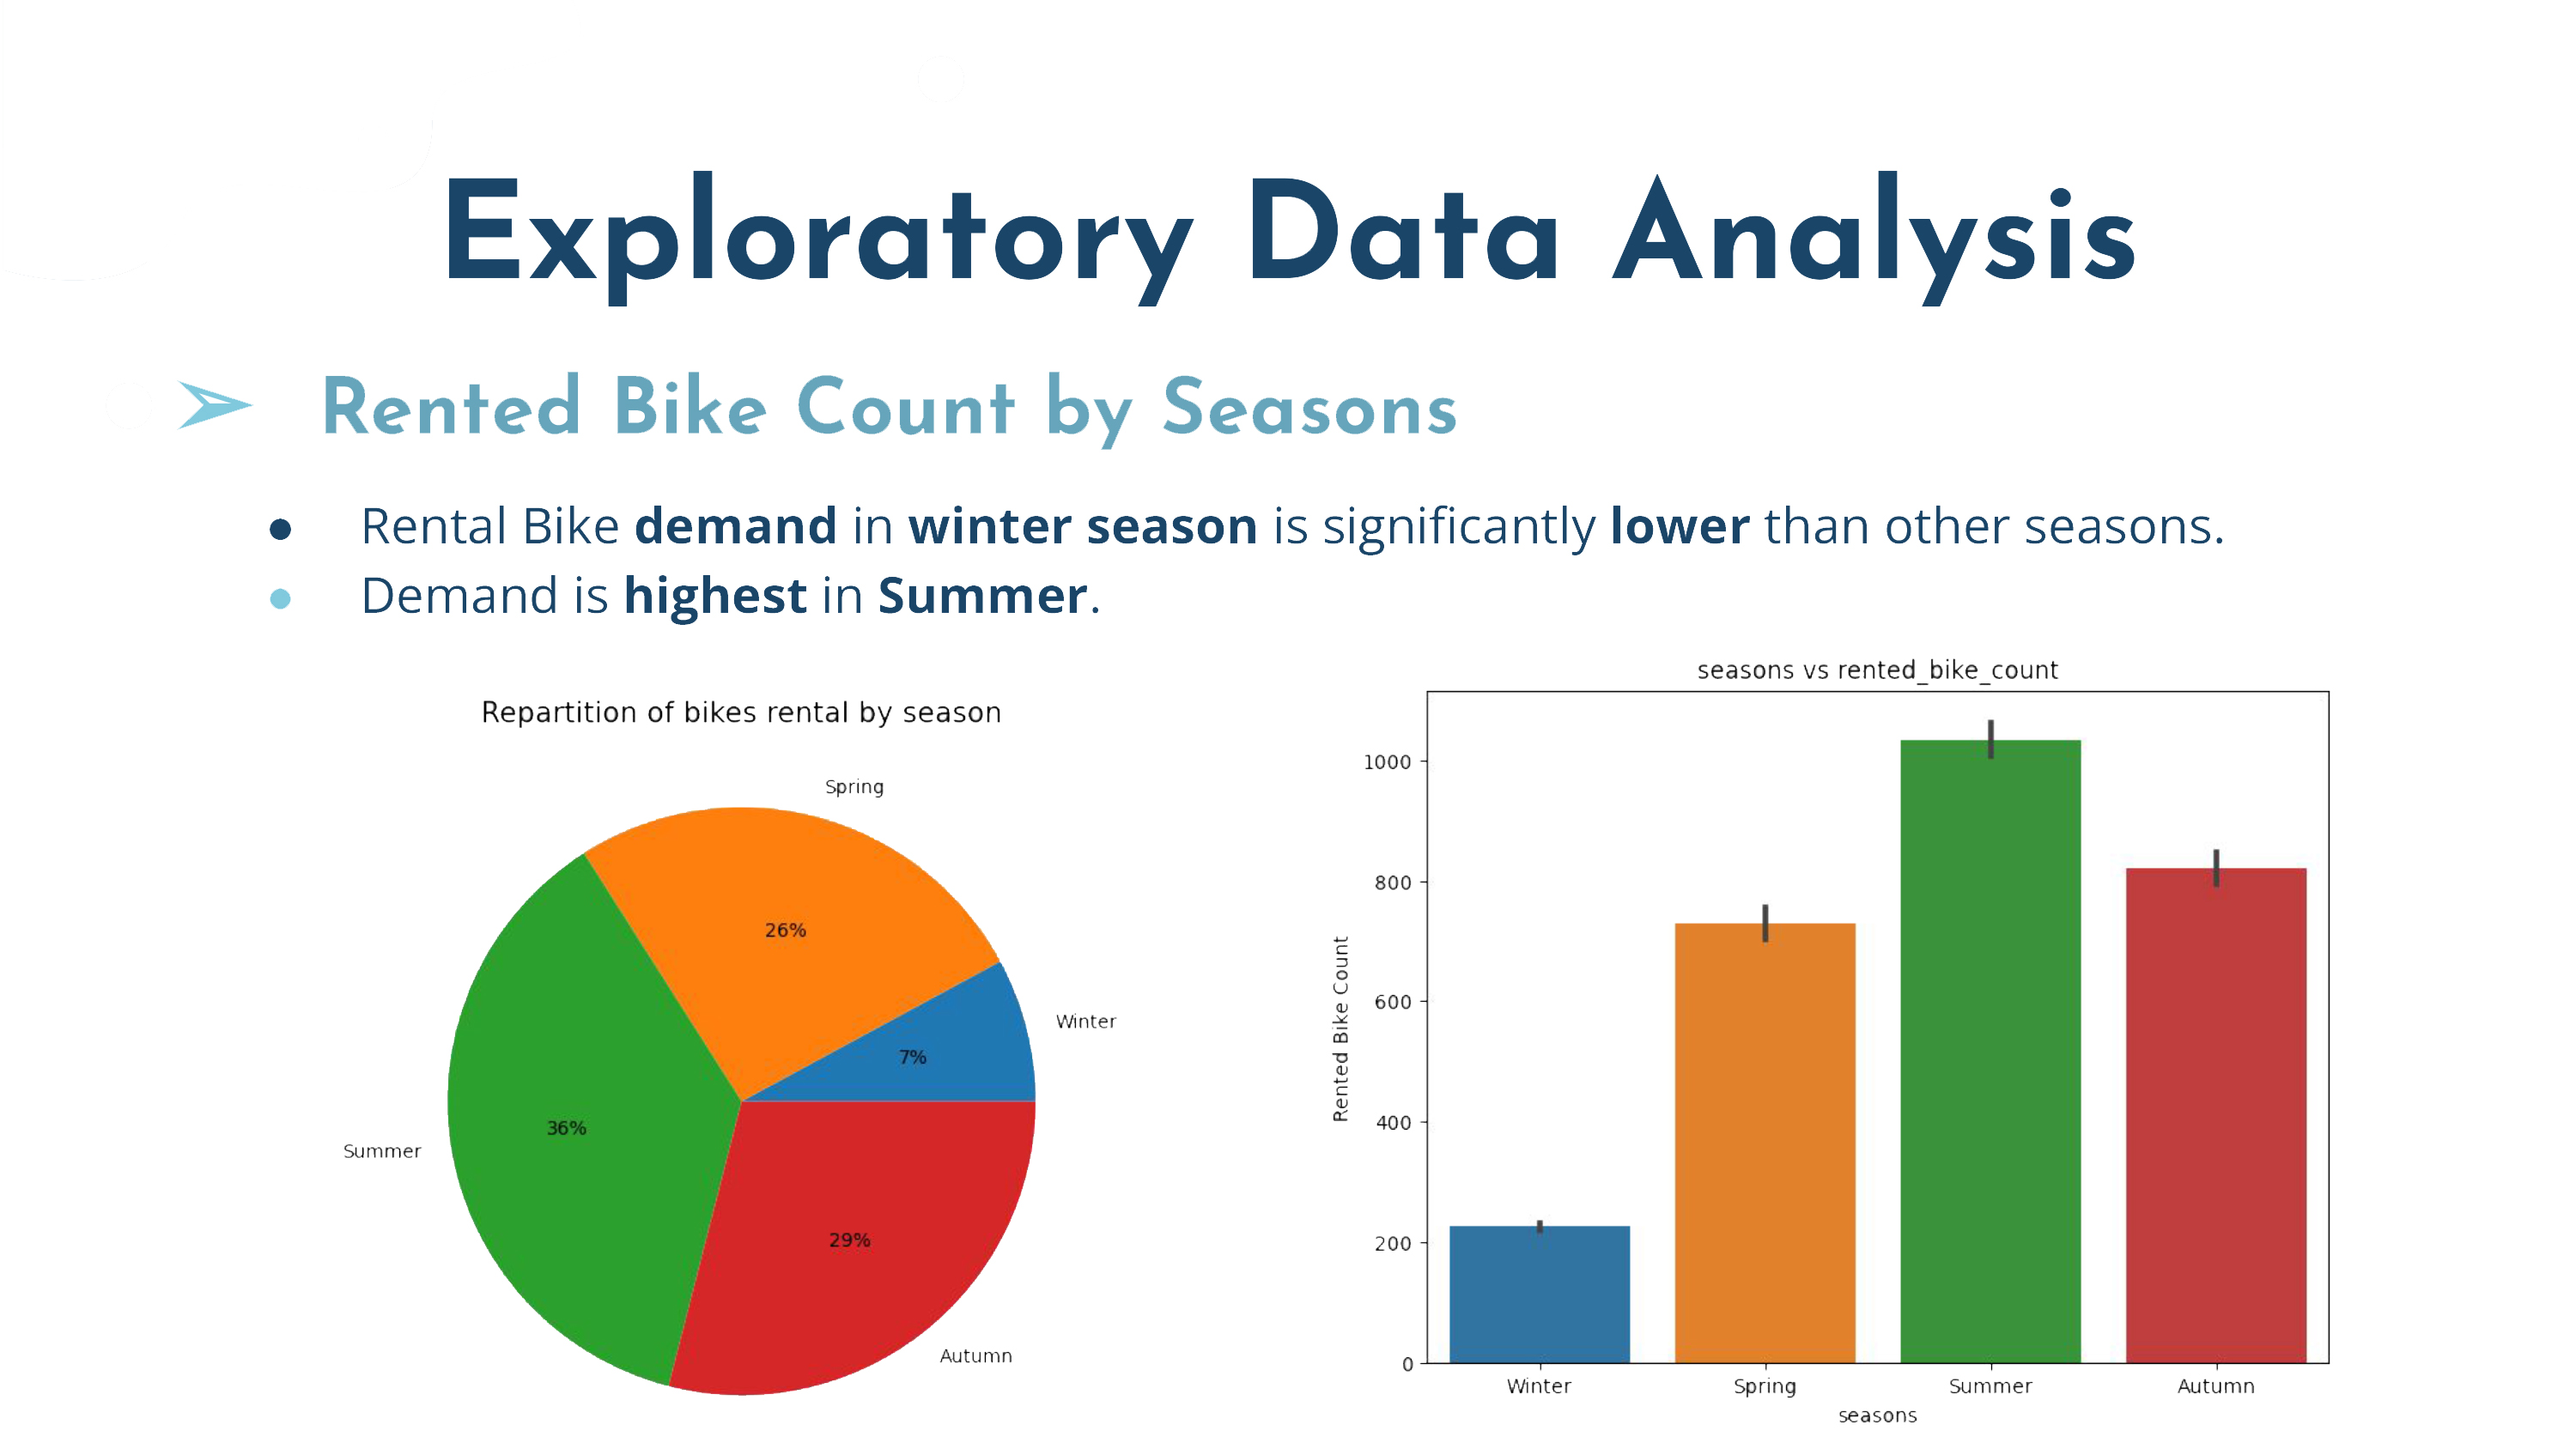
- Seasonal Demand: Fall (Category 3) showed the highest median demand, while Spring (Category 1) had the lowest.
- Yearly Comparison: 2019 had a higher user count than 2018.
- Weekly Trends: Demand remained stable throughout weekdays, suggesting the weekday variable might not be crucial for predictions.
- Weather Impact: Clear weather saw user counts ranging from 4000 to 6000.
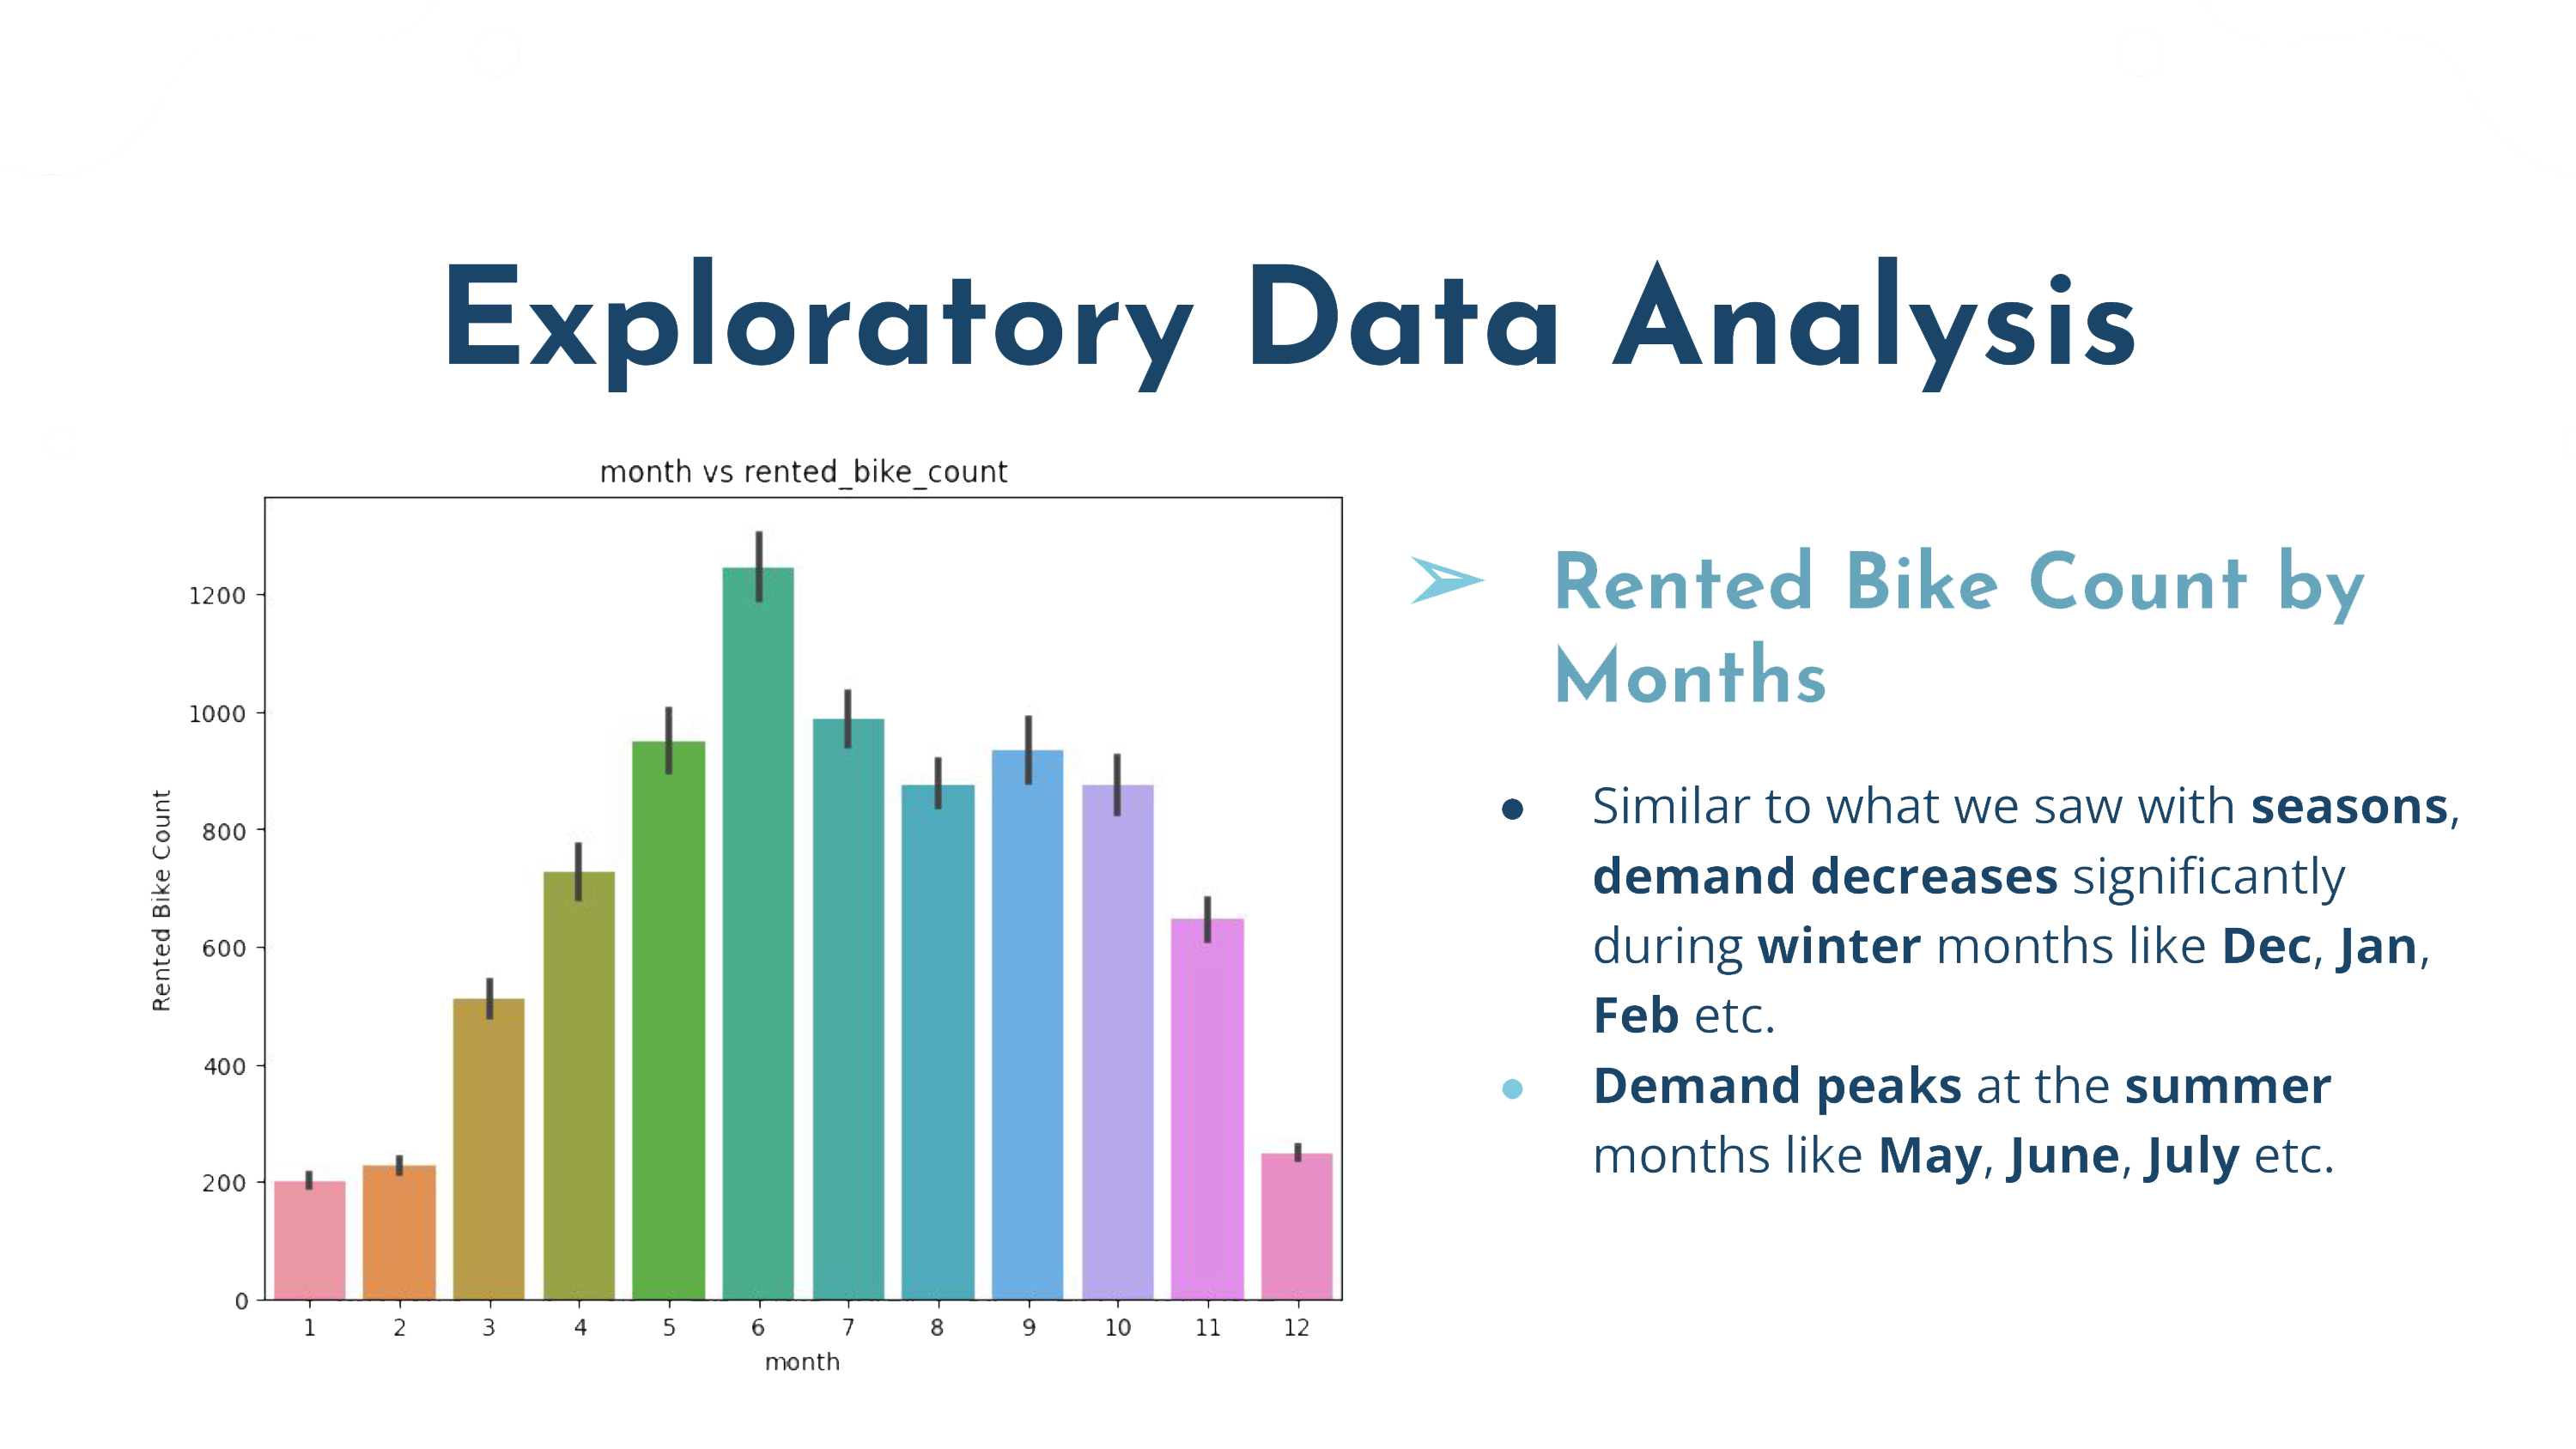
- Monthly Trends: Mid-month bookings often exceeded 4000, with October having the highest demand count.
- Holiday Effect: Lower user count during holidays.
- Working Days: Bookings ranged from 4000 to 6000, unaffected by whether it’s a working day.
Recommendations:
- Focus on January, July, September, November, and December due to higher demand.
- Monitor weather conditions as demand increases with warmer temperatures.
- Prepare for high demand during winter to meet customer needs.
By implementing these insights, BoomBikes can strategically plan to meet anticipated post-quarantine demand, ensuring customer satisfaction and boosting profitability.