Online Shopping Analytics Project: In an era dominated by online commerce, understanding customer behavior is paramount. This project delves into the dynamics of online shopping, aiming to extract actionable insights from a comprehensive dataset.
Project Overview
Dataset: The project utilized the "Online Shopping Dataset" sourced from Kaggle. This dataset contains comprehensive information, including customer demographics, transaction details, product descriptions, and more. It played a crucial role as the foundation for exploring various aspects of online shopping behavior.
Dataset Source: '🛒 Online Shopping Dataset 📊📉📈'
Project Objective(s):
The Online Shopping Analytics project aims to gain actionable insights into customer behavior and transactional patterns within the context of the online shopping dataset. The primary objective was to understand various dynamics, including customer demographics, product popularity, spending patterns, and engagement with promotional activities such as coupons.
Exploration Questions:
The project aimed to address key questions related to online shopping behavior:
- What are the demographics of online shoppers, and how is the platform utilized by different genders and locations?
- Which products or product categories are most popular among customers?
- How do spending patterns vary throughout the year, and what role do discounts and coupons play?
- Who are the highest spending customers, and what are their preferences?
Tools and Technologies:
The project utilized the following tools and technologies:
- SQL (Structured Query Language): The primary language used for data manipulation, exploration, and analysis.
- SQL Server Management Studio (SSMS): For database creation, data parsing, and initial data exploration.
- Tableau: For creating a variety of visualizations and interactive dashboards based on SQL query findings.
- Excel: While not directly used in the project, the dataset obtained from Kaggle was in Excel format, serving as the initial file type for data exploration.
Approach:
- Obtained the online shopping dataset in Excel format from Kaggle, encompassing customer demographics, transaction details, and product descriptions.
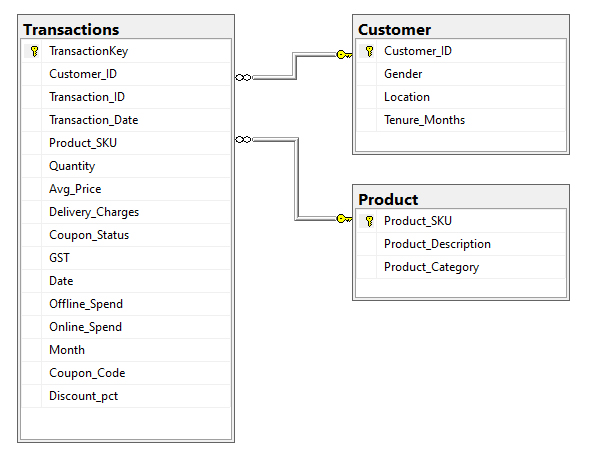
- Created a relational database in SQL Server Management Studio (SSMS) using SQL queries to establish tables for Customer, Product, and Transactions.
- Imported the Kaggle dataset into SSMS and utilized SQL queries to parse the data into their respective tables.
- Ensured data quality and consistency by addressing any missing or inconsistent values.
- Conducted a comprehensive exploration of the dataset using SQL queries.
- Examined key attributes, identified patterns, and gained insights into customer demographics, product popularity, and transactional patterns.
- Transitioned the database to Tableau for developing insightful visualizations based on SQL query findings.
- Developed a variety of visualizations, including bar graphs, area graphs, and packed bubble charts.
- Grouped visualizations into dashboards focusing on key aspects such as customer demographics, sales analysis, location insights, consumer spending, and coupon engagement.
Data Visualizations:
Transitioning to Tableau, the SQL query findings were used as a basis to create a variety of visualizations. Each visualization aimed to reveal patterns, trends, and relationships within the dataset. Notable visualizations included:
- Bar Graphs: Customer demographics, total sales by product category, highest spending consumer analysis.
- Area and Bar Graphs: Average discount percentage vs total sales throughout the year.
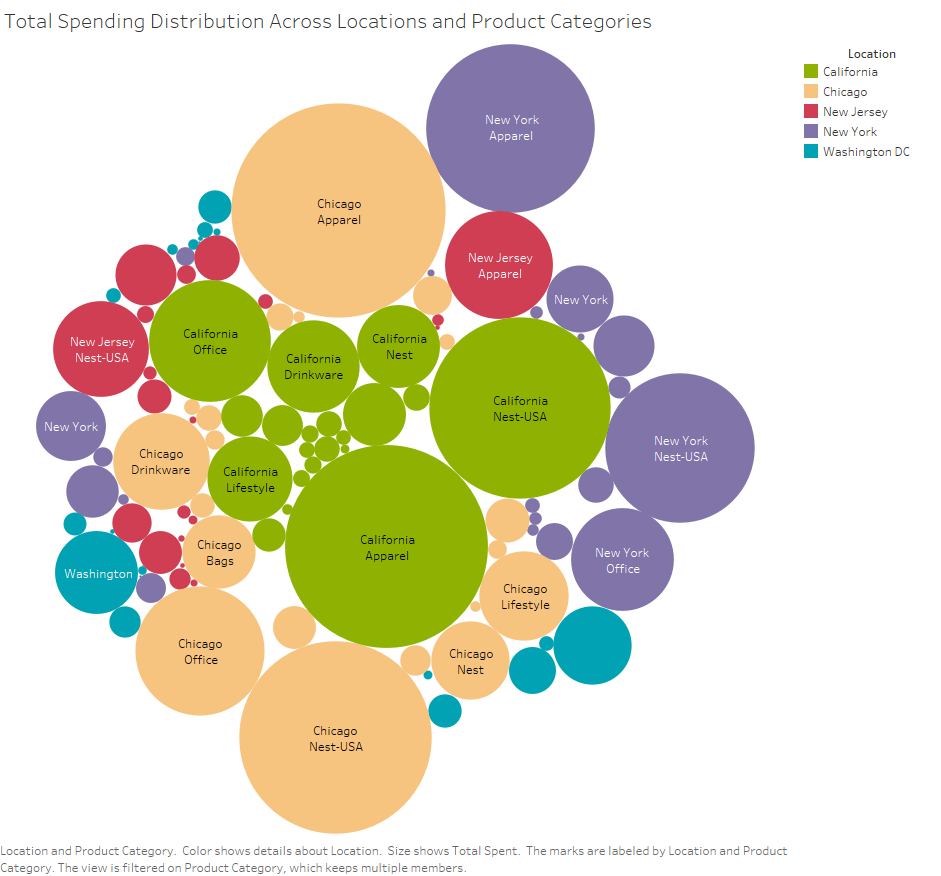
- Packed Bubble Chart: Total spending distribution across locations.
- Treemaps: Product categories by total sales.
- Customer Demographic Dashboard: Highlights gender distribution by location.
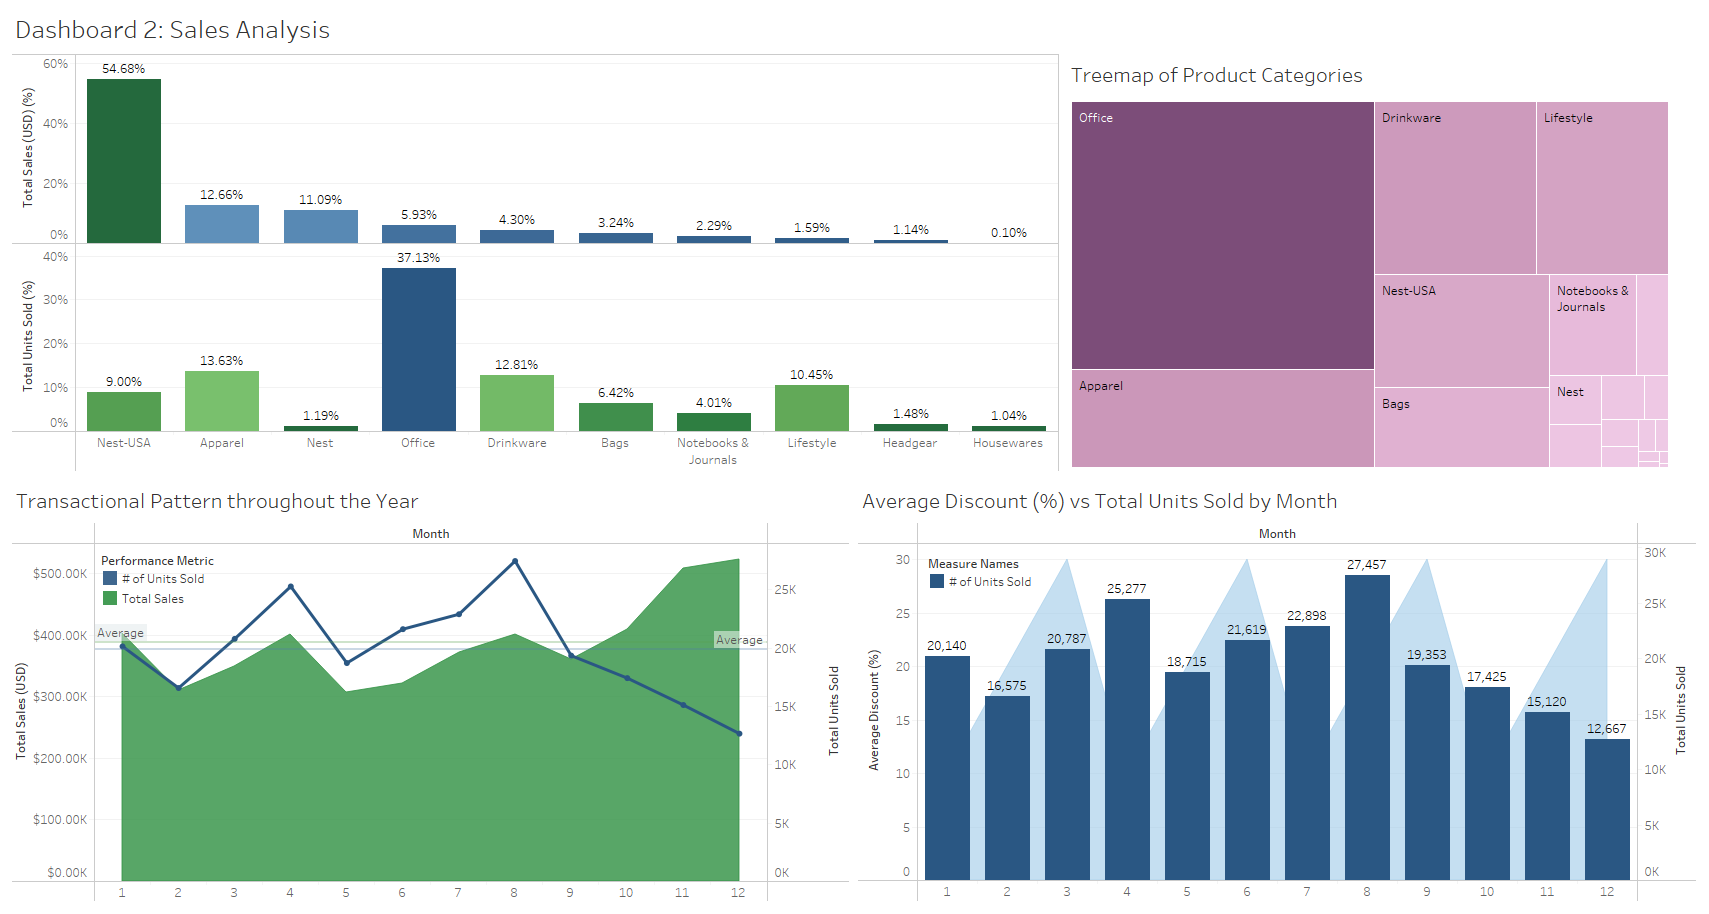
- Sales Analysis Dashboard: Analyzes total sales by product category, transactional patterns, and customer distribution by gender and tenure range.
- Location Analysis Dashboard: Explores total spending distribution across locations and product categories.
- Consumer Spending Dashboard: Focuses on the highest spending consumers and their product breakdown.
- Coupon Engagement Dashboard: Analyzes coupon engagement by percentage and throughout the year.
- Online Shopping Insights Hub: Integrates all five dashboards into a single interface, offering in-depth analysis of insights and patterns.
Files Included:
- 'Individual Visualizations': The individual visualizations created in Tableau based on SQL query findings.
- 'Dashboards': The interactive dashboards created on Tableau. Note: These are just images of the interactive dashboards.
- 'README.md': This file provides an overview of the project.
- 'create_database.sql': The Raw SQL query for constructing the relational database.
- 'analyze_data.sql': The Raw SQL query for extensive dataset exploration.
- 'er-diagram.png': This file provides a simple ER diagram depicting the relational database structure.
- 'online_shopping_analytics.twbx': This Tableau file compromises all the data visualizations and interactive dashboards.
Conclusion:
- Customer Demographic: The Customer Demographic Dashboard reveals a notable gender distribution, with a significant skew towards females across all locations. Additionally, female customers exhibit a longer average tenure on the platform compared to their male counterparts. Further exploration is recommended to understand the gender distribution concerning specific product categories.
- Sales Analysis: The Sales Analysis Dashboard uncovers that office items dominate in terms of the number of sales, constituting 37% of the platform's total sales. Surprisingly, offline spending contributes significantly to the overall customer expenditure, meaning that in-store sales are still superior to online sales. Contrary to initial assumptions, the correlation between discounts and total sales or customer spending is not as substantial.
- Location Analysis: The Location Analysis Dashboard highlights the outstanding performance of Chicago and California compared to New York, New Jersey, and Washington D.C. Interestingly, apparels emerge as the leading category in terms of total spending in Chicago and California, contrary to the fact that office items are the most frequently purchased.
- Consumer Spending: Examining the Consumer Spending Dashboard reveals that the highest spending customers predominantly invest in apparel, Nest, office, and drinkware items. This aligns well with the findings in other dashboards concerning product categories.
- Coupon Engagement: The Coupon Engagement Analysis indicates that the coupon usage rate remains relatively constant throughout the year, despite fluctuations in the number of coupons clicked, peaking in August. This suggests that the current coupon discounts may not be compelling enough to significantly impact customer purchasing behavior.