PwC Power-BI in Data Analytics Project: The virtual PowerBI Case experience is an excellent starting point for a Data Analyst looking to build a career with Power BI. This experience consists of three case studies on three different datasets. The real-world datasets help you understand the business scenarios and steps to solve the business problems.
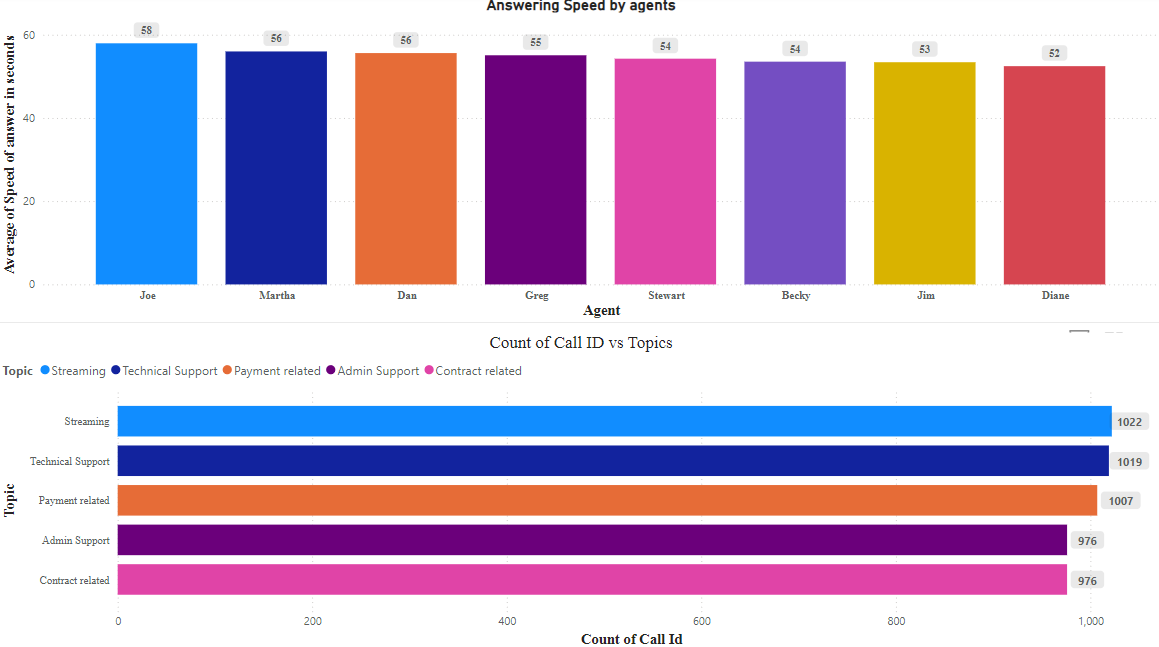
Case Study 1: Call Centre Trends
- Analyzing the number of incoming calls, call agent's performance, speed of answer, call duration, trends on a daily and hourly basis, and customer satisfaction ratings.
- The dashboard defines key KPIs that impact customer satisfaction and call agent performance.
- The goal is to identify opportunities where performance can be monitored and enhanced.
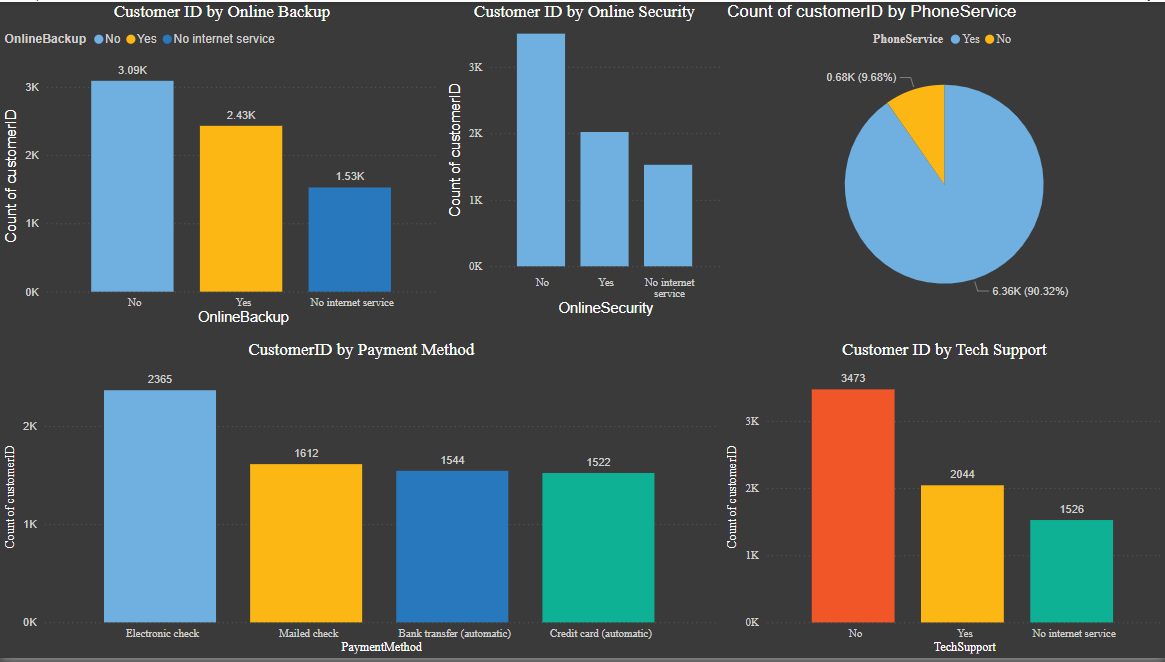
Case Study 2: Customer Retention Dashboard
- The organization seeks to identify customers likely to churn.
- The dashboard creates KPIs around demographics, company service, and customer profiling to identify which customers are at high risk of churning.
- The analysis provides key insights to help board members take steps to reduce churn and increase customer loyalty.
Case Study 3: HR Analytics - Diversity and Inclusivity
- Creating a dashboard to track employee participation in the organization.
- Defining KPIs such as New Hires, Promotions, Employee Exits, and Employee Gender Ratio to understand the situation of diversity and inclusivity in the workforce.
- Enabling diversity and eliminating gender-based stereotyping is key to a balanced workforce and company success.