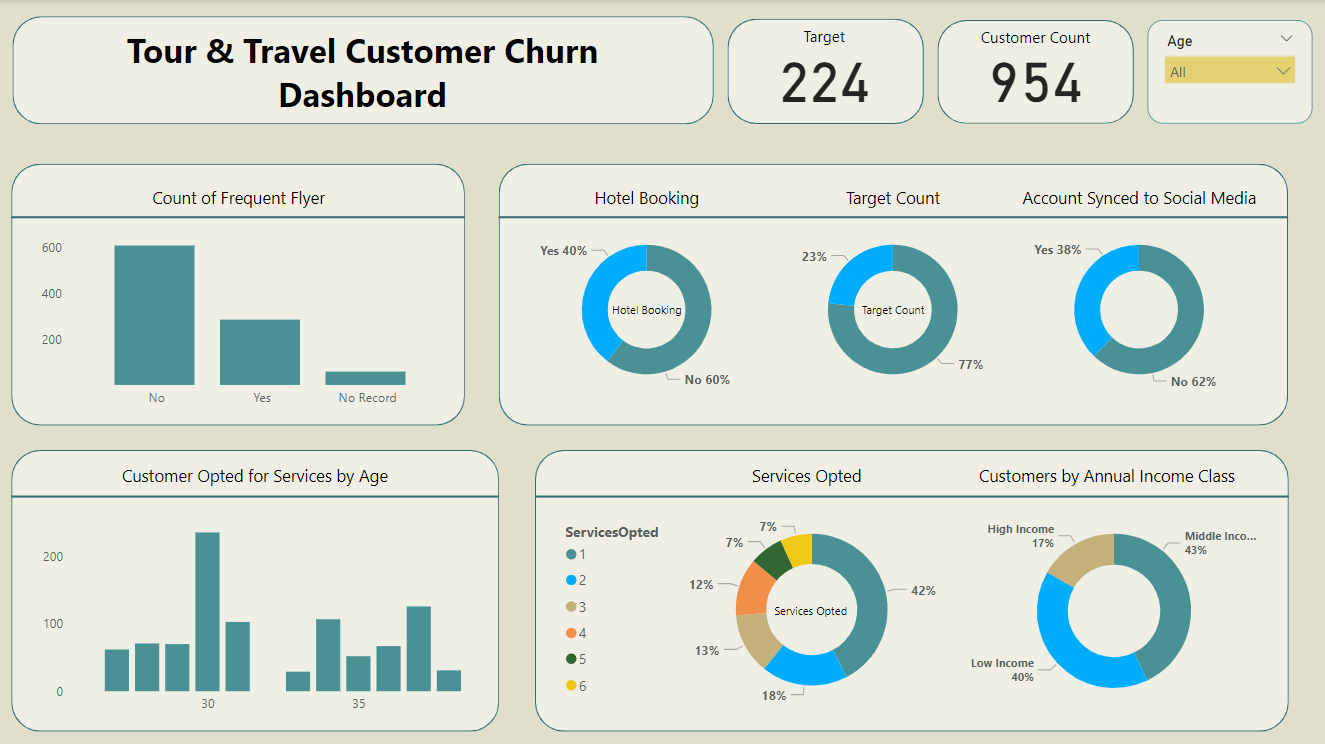
Tour and Travel Customer Churn Dashboard: Analyzing customer behavior in the tour and travel industry to predict churn and enhance retention strategies through actionable insights.
Overview:
- Comprehensive analysis of factors influencing customer churn in the tour and travel sector.
- Focus on frequent flyer trends, service preferences, and demographic insights to identify key patterns.
- Aim to predict customer churn and retention trends effectively.
Objective:
- Identify critical factors driving customer churn and retention.
- Deliver actionable insights to improve retention strategies for tour and travel businesses.
Key Features:
- Frequent Flyer Count by Age: Visualizes the distribution of frequent flyers across age groups to identify key demographics.
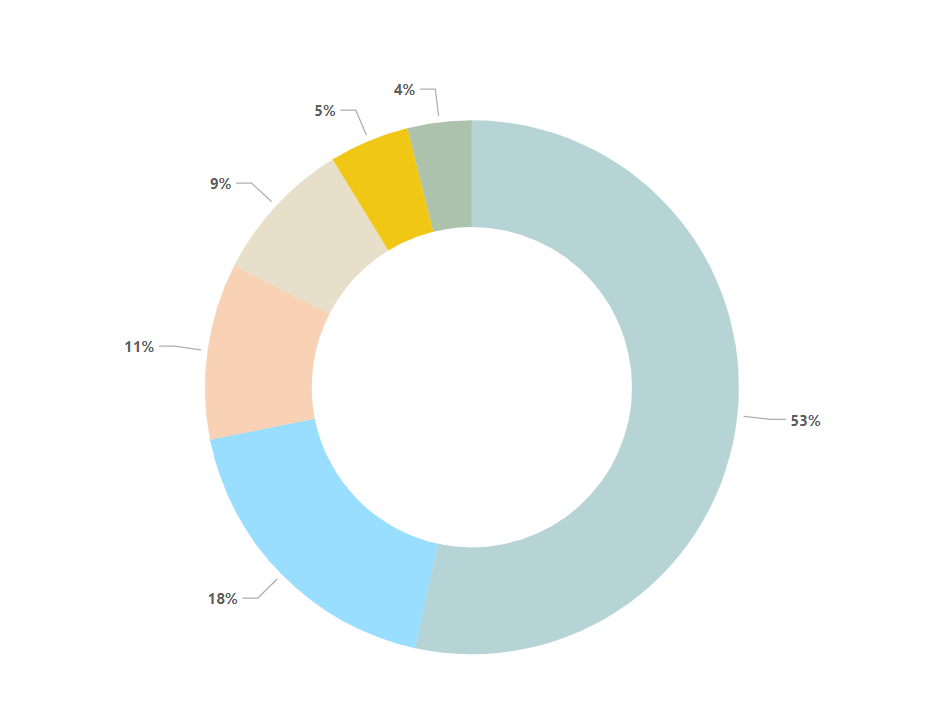
- Service Opted by Age: Correlation analysis between age groups and service preferences, highlighting popular services by age bracket.
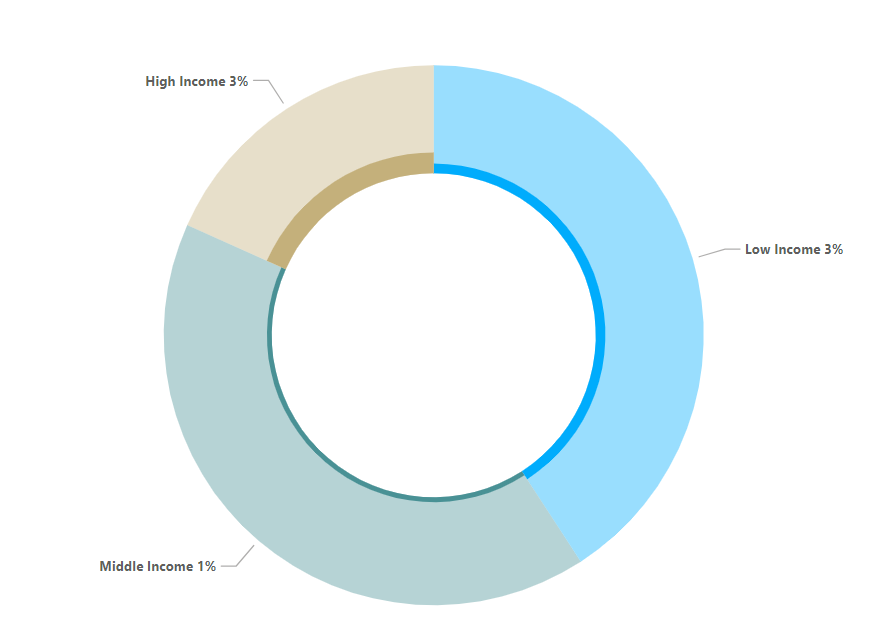
- Service Opted and Customer by Income Class: Explores variations in service preferences across annual income classes.
- Hotel Booking Preferences: Identifies patterns in hotel choices, supporting targeted marketing strategies.
- Target Count Analysis: Breaks down churn-prone customers versus retained ones for focused retention efforts.
- Account Synced to Social Media: Examines how social media engagement impacts customer retention rates.
- Target Customers and Total Customer Count: Compares at-risk customers to total customer count, assessing retention strategy impact.
- Filtered Analysis by Age: Provides age-specific trends and behavior insights through segmented data analysis.
Conclusion:
- The analysis emphasizes personalized strategies to minimize customer churn.
- Findings underscore the importance of age and income in service preferences and social media engagement.
- Identified patterns in hotel bookings can refine marketing approaches.
- The insights contribute to enhancing customer retention strategies in the travel industry.
Tools Used:
- Power BI: To create interactive dashboards and visualizations.
- DAX (Data Analysis Expressions): Used for data modeling and advanced calculations in Power BI.