This project involved analyzing Zomato restaurant data using advanced Excel functions, SQL queries, and creating interactive dashboards with Power BI and Tableau.
Objectives:
- Build a country map table.
- Create a calendar table using `datekey` and add columns like year, month number, full month name, quarter (Q1-Q4), year-month (YYYY-MMM), weekday number, weekday name, financial month (April = FM1, May = FM2, ... March = FM12), and financial quarter.
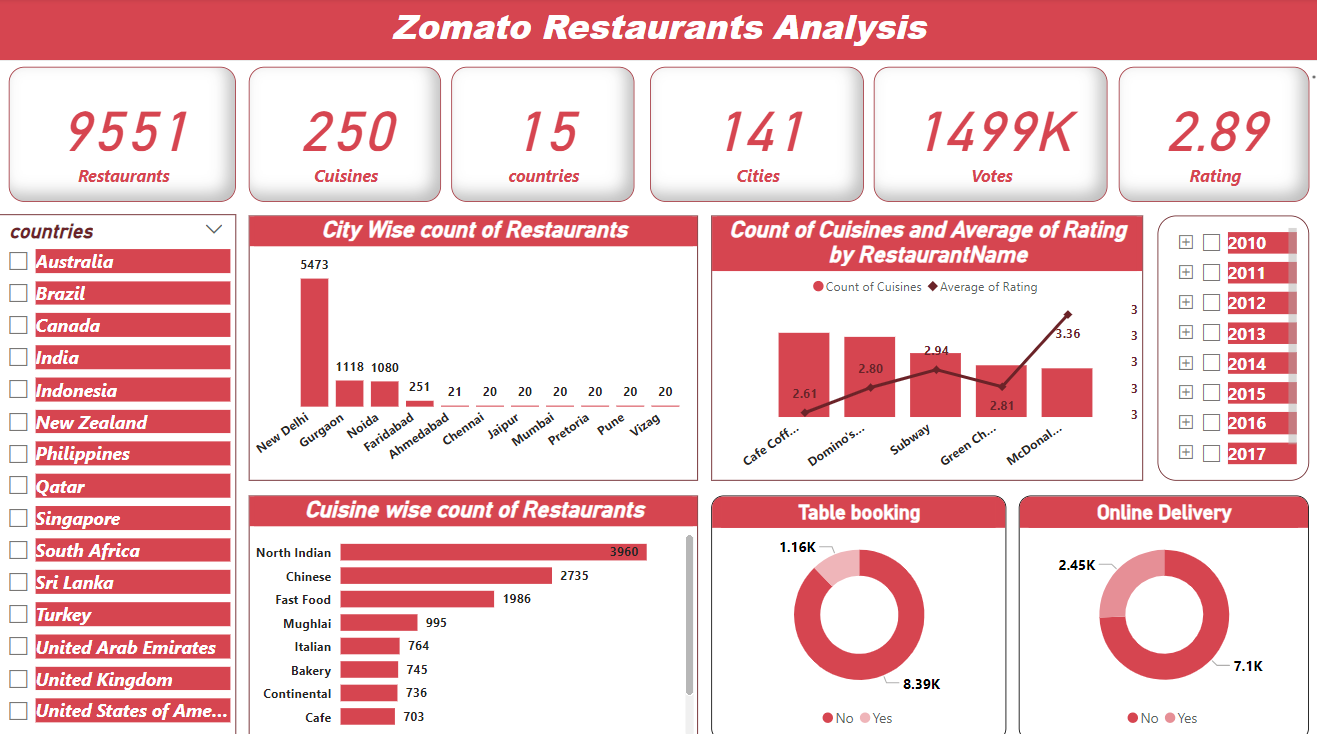
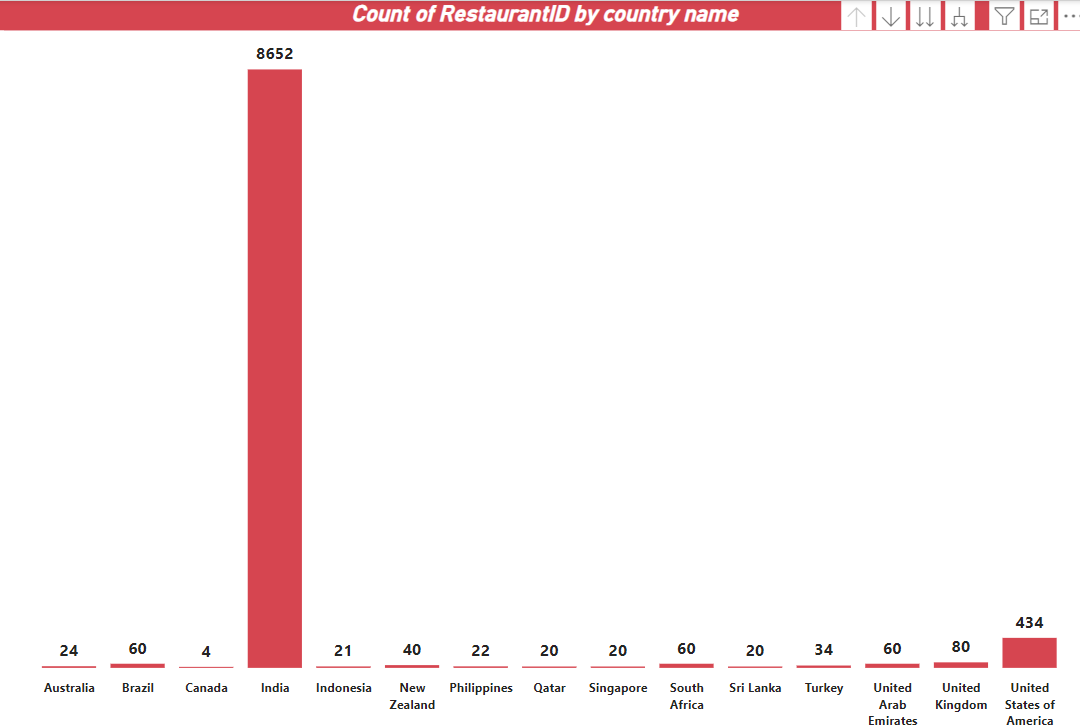
- Find the number of restaurants by city and country.
- Analyze restaurant opening trends by year, quarter, and month.
- Count restaurants by average ratings.
- Create buckets for average price ranges and calculate how many restaurants fall into each bucket.
- Calculate the percentage of restaurants offering table booking and online delivery options.
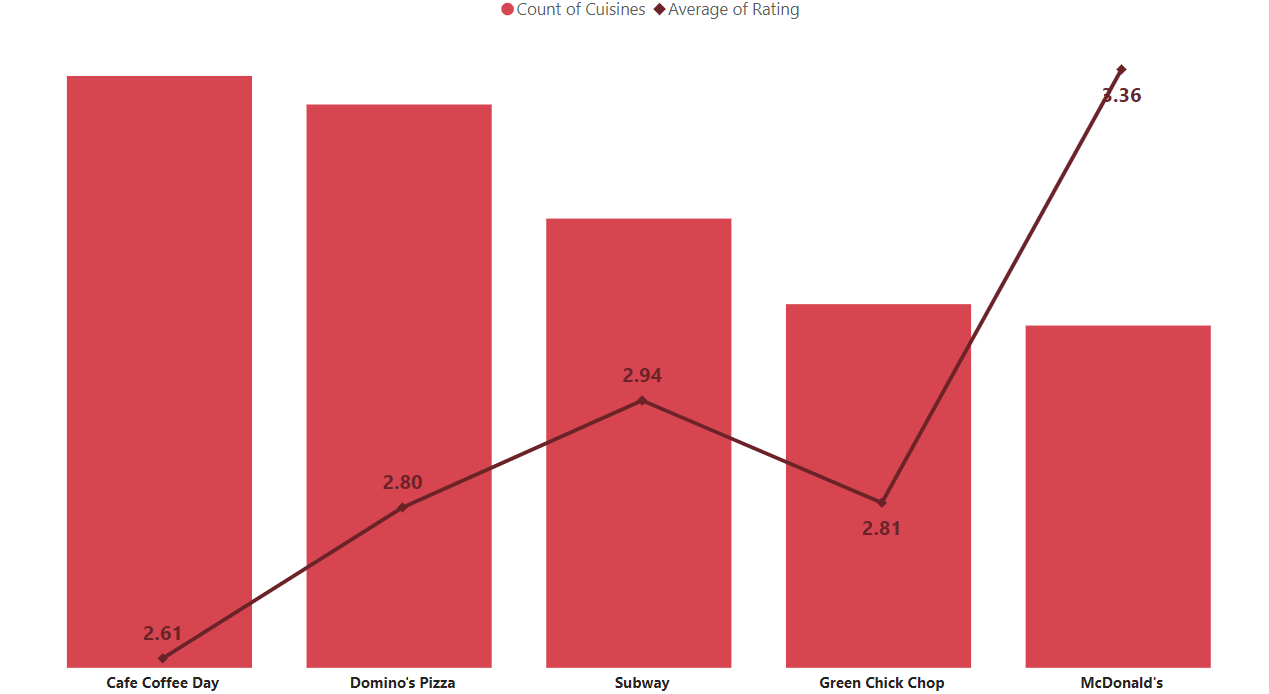
- Develop charts based on cuisines, city, ratings, and other relevant parameters.
Tools and Techniques Used:
Excel:
- SUMIFS and COUNTIFS functions for conditional data extraction and counting.
- PivotTables and PivotCharts for data summarization and visualization.
- Conditional formatting to highlight key insights.
- Report connections to link multiple PivotTables and charts to a single slicer for dynamic filtering.
- VLOOKUP and INDEX-MATCH functions for merging data from different tables.
- DATE and YEAR functions for extracting date-related information.
SQL:
- SELECT, FROM, WHERE, GROUP BY, ORDER BY, and HAVING clauses for data extraction and filtering.
- Window functions like ROW_NUMBER, RANK, and DENSE_RANK for calculations on subsets of data.
- Date functions such as DATEADD, DATEDIFF, and DATEPART for date manipulations and calculations.
Power BI:
- Data modeling using relationships between tables and calculated columns.
- Measures and DAX formulas for advanced calculations.
- Visualizations like tables, charts, and maps to present data.
- Slicers and filters for dynamic filtering.
- Drill-through functionality to navigate between different levels of data detail.
Tableau:
- Data blending to combine data from multiple tables.
- Calculated fields for data manipulation.
- Dimensions and measures for data organization.
- Visualizations such as maps, charts, and tables for insights.
- Filters and parameters for dynamic data filtering.
Outcome: This project showcases the integration of Excel, SQL, Power BI, and Tableau for data analysis and visualization. It provides insights into restaurant industry trends, including location preferences, opening trends, ratings, and price ranges, while serving as a learning resource for these tools and techniques.